Date published: January 20, 2025
Author: Oluwabusola Balogun

In this series, we have discussed how data is essential for every organization to help them make informed decisions. Data is a guiding compass, helping organizations navigate their way to informed decisions. However, raw data, like scattered puzzle pieces, needs careful assembly before it reveals the full picture. This is where the data analysis process comes into play.
The data analysis process is a structured journey from questions to actionable insights. Data analysis was also defined as collecting, cleaning, transforming, and showing relationships between facts or figures to extract useful information and support decision-making. However, data analysis begins with a purpose. Before gathering data, there must be a clear reason for doing so and a plan to uncover the answers. This journey starts with asking the right questions.
Imagine a young couple searching for their dream apartment. Their decision depends on factors like budget, road conditions, electricity availability, proximity to work, and neighborhood safety. These questions help them identify the right data to gather. Similarly, data analysts begin by defining clear goals and framing the right questions to address business needs.
For instance, business stakeholders may ask:
Having the right questions in mind helps analysts focus on relevant data. For example, a fictional company wants to evaluate its website performance for the first quarter of a new year. The reasons could include setting benchmarks, identifying issues, and budgeting for marketing campaigns. Once the questions are set, the next step is collecting the data.
Now that the questions and goals are clear, how does the analyst gather the data? The first step is recognizing the data structure, identifying where the data is stored, and understanding its type.
Structured data, stored in tables, may be found in CSV files, Excel sheets, or relational databases like MySQL and Microsoft SQL Server. Knowing the structure and type of data helps analysts determine the tools needed for analysis. Furthermore, recognizing data type whether the data is categorical or numerical will help the analyst determine how to perform the analysis to derive insights
Returning to our fictional company, I got a dataset from Kaggle although it is a large dataset I picked a couple to demonstrate how the analysis process works. So, we are going to imagine that as an analyst you meet up with the other teams and departments to collect the data that would have been stored on web analytics or use web analytics to gather the data to be analyzed. Our fictional data is in Microsoft Excel a spreadsheet application. Now that the data has been collected, that moves us to the next process which is Data Processing.
Raw data rarely comes ready for analysis. Even structured data can have missing values, inconsistencies, incorrect data types, or outliers. These issues must be resolved before meaningful analysis can begin.
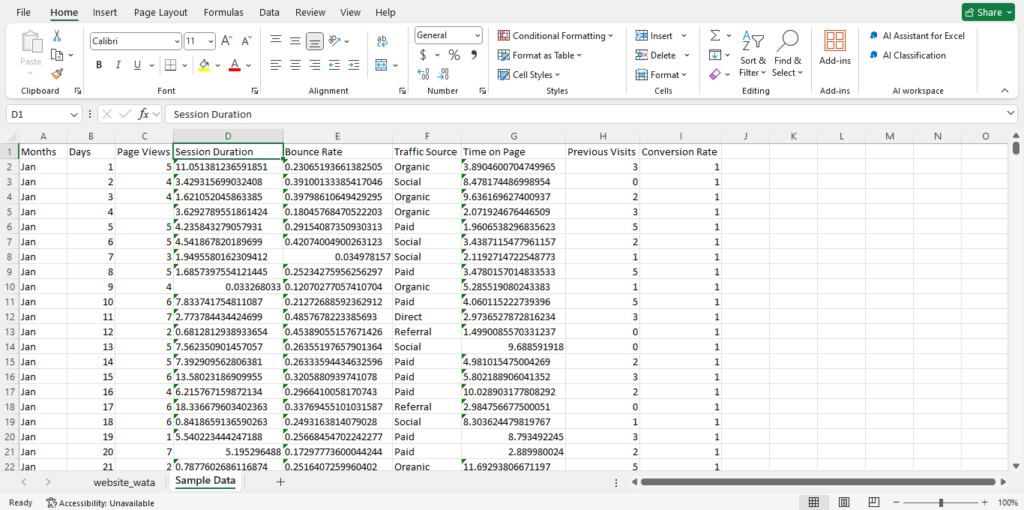
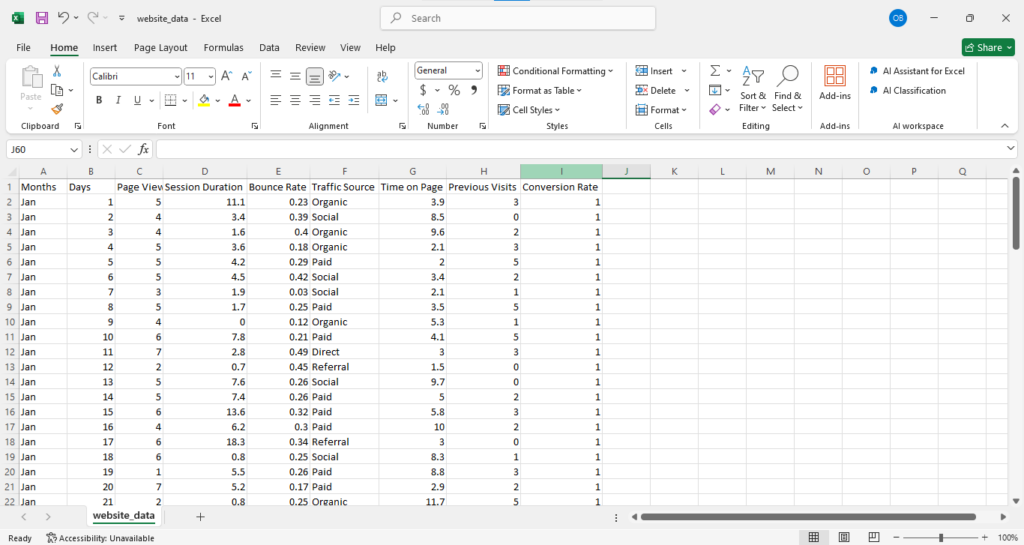
For example, in the dataset, you might notice missing values, bounce rates recorded as numbers instead of percentages, or columns too narrow to display headers. Cleaning the data involves fixing these issues to ensure accuracy and clarity.
According to Datacamp, analysts spend nearly 80% of their time processing data before analyzing it. This means that without properly cleaning a dataset it will be impossible for a data analyst to get accurate insight from the data. Once the data is clean, the stage is set for the exciting part: data analysis.
The moment has arrived to uncover insights from the dataset. This step often involves basic statistical calculations like averages, sums, medians, ranges, standard deviations, and variances. These statistics form the foundation of descriptive analysis, making it accessible even to beginners. Resources like Khan Academy offer basic statistics and probability courses for those who want to learn more. Data can also be analyzed through advanced machine learning and algorithms.
In our fictional dataset, we analyze performance metrics such as total page views, session durations, bounce rates, traffic sources, and conversion rates. These calculations reveal how the website performed during the year’s first three months. But numbers alone aren’t enough—stakeholders need the insights presented engagingly. That brings us to visualization and communication.
Imagine presenting a spreadsheet filled with rows of numbers to stakeholders. Without context or clarity, the data might as well be a foreign language. Visualization is crucial—it transforms raw numbers into a compelling story. The picture below shows the website traffic report for our fictional dataset.
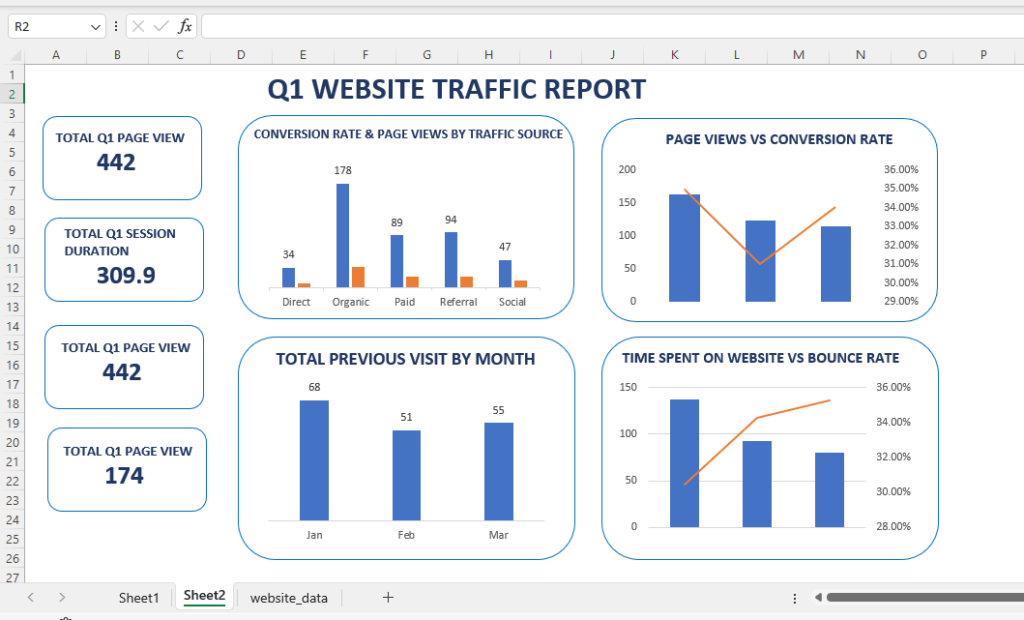
The report shows that the website had 442 page views for the first three months of the year and a 309-minute, 9-second session duration. Organic traffic drives the highest performance, while direct and social traffic has the lowest. It is also obvious that page views decrease over the three months while the conversion rate fluctuates. When time spent on the website is higher, bounce rates are lower. These are just some insights gained from looking at the picture.
“A picture is worth a thousand words,” and graphs or charts like histograms (to show data distribution) or line graphs (to display trends over time) bring data to life. By visually representing the findings, analysts help stakeholders quickly grasp the story behind the data, making the insights more impactful.
The data analysis process is a journey—from asking the right questions to collecting and processing data, analyzing it, and finally communicating the results. It’s a deliberate, methodical approach that ensures organizations extract accurate and actionable insights from their datasets.
So, the next time you see a beautifully designed graph or hear about groundbreaking data-driven decisions, remember the process behind it—a journey that transforms raw facts into powerful knowledge.


Let's discuss and bring your vision to life
We have a team of experience designers, developers, marketer and customer experience specialist all to ensure you get served professionally.
marketing@proflinksmedia.com
Copyright © 2014-2025 by Proflinks Media & ICT. All rights reserved.